Finding signal on Twitter is more difficult than it used to be. We curate the best tweets on topics like AI, startups, and product development every weekday so you can focus on what matters.
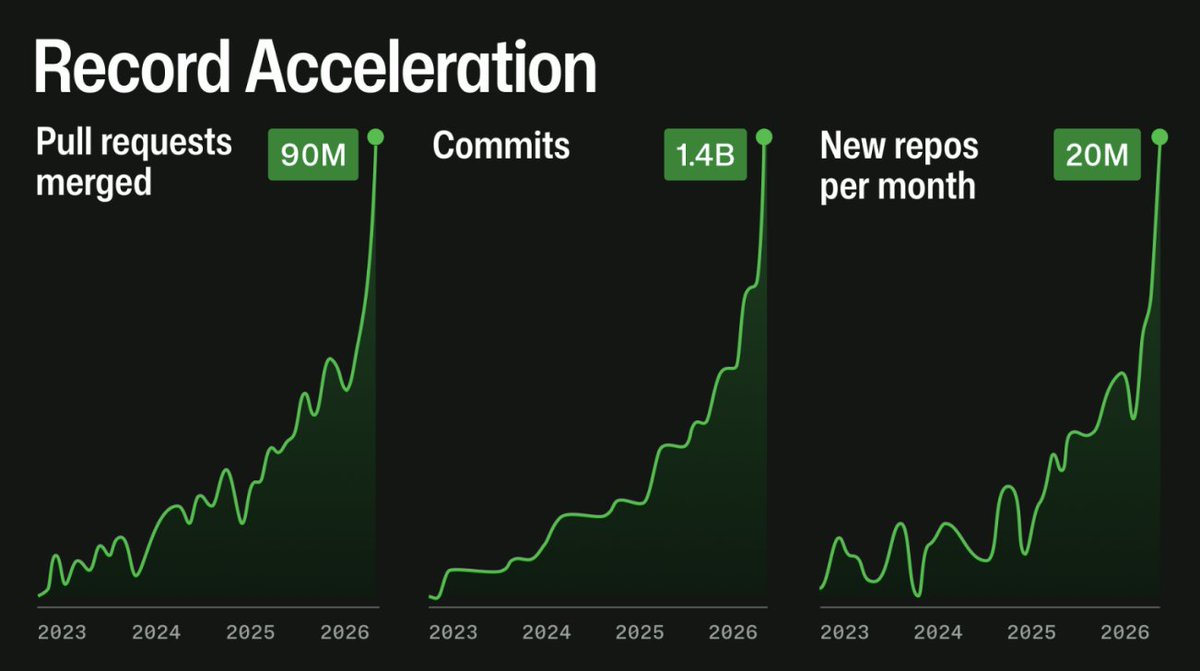
This chart - coming from GitHub is hard to interpret, thanks to | Tech Twitter
Press Space to continue
This chart - coming from GitHub is hard to interpret, thanks to missing information.
1. Where does this chart start? Aka what are the values in 2023? Surely it's not 0. But is it e.g. 10M? 30? 50?
2. What are we measuring? Is it 90M PRs per months, 1.4B commits per month?